Review Article | | Peer-Reviewed

A Multi-layer Perceptron Framework for Pre-admission Disciplinary Risk Prediction in Nigerian Universities: A Fairness-aware Approach Using Synthetic Data

Received: 20 April 2026     Accepted: 29 April 2026     Published: 18 May 2026
Views:       Downloads:
Abstract

Nigerian universities have long struggled to identify, before matriculation, which applicants are likely to become disciplinary problems on campus. Existing screening procedures are largely manual and reactive — problems surface after enrolment rather than at the gate. To close this gap, we built and tested a Multi-Layer Perceptron classifier that assigns each applicant a probabilistic risk score at the point of admission, giving institutional officers an evidence-based basis for early counselling and targeted resource deployment, well before misconduct occurs. Working with real student records was not feasible. Nigeria's data protection obligations impose strict constraints on profiling, and authentic admission data from universities was unavailable for this research. We therefore generated 5,000 synthetic applicant profiles using a Conditional Tabular GAN, a method purpose-built for datasets that mix continuous, ordinal, and categorical variables. Three statistical tests — the Kolmogorov–Smirnov statistic, Wasserstein distance, and Jensen–Shannon divergence — confirmed that the synthetic profiles reproduced the structural properties of realistic admission populations with high fidelity. Under five-fold stratified cross-validation, the MLP returned an accuracy of 0.841 ± 0.018, F1-score of 0.812 ± 0.021, and AUC-ROC of 0.891 ± 0.014, outperforming Logistic Regression, Random Forest, SVM, and XGBoost across all reported metrics. Two findings deserve particular attention. First, SHAP attribution analysis singled out prior disciplinary record and JAMB score as the variables driving predictions most strongly — a result with direct implications for what admissions officers should scrutinize. Second, the model treated applicants from different geopolitical zones unequally; an EOD of 0.078 across zones exceeded acceptable thresholds. Fairness-regularized retraining brought that Figure down to 0.043 with less than one percentage point of accuracy lost. To prevent the system from operating as a black box, a three-tier human-in-the-loop review protocol is proposed, and the entire deployment framework is mapped against Nigeria's National Data Protection Regulation and Data Protection Impact Assessment requirements.

Published in International Journal of Engineering Management (Volume 10, Issue 1)
DOI 10.11648/j.ijem.20261001.11
Page(s) 1-13
Creative Commons

This is an Open Access article, distributed under the terms of the Creative Commons Attribution 4.0 International License (http://creativecommons.org/licenses/by/4.0/), which permits unrestricted use, distribution and reproduction in any medium or format, provided the original work is properly cited.

Copyright

Copyright © The Author(s), 2026. Published by Science Publishing Group

Keywords

Multi-layer Perceptron, Algorithmic Fairness, Synthetic Data, CTGAN, SHAP Explainability

1. Introduction
Educational Data Mining (EDM) research has consistently emphasized that extracting hidden patterns from educational data can help decision-makers improve teaching and learning by detecting undesirable student behaviors and predicting student performance, which directly motivates risk-scoring systems that summarize complex signals into actionable indicators . In higher education, early identification of at-risk individuals is presented as a practical mechanism to enable targeted support strategies intended to reduce adverse outcomes and to optimize the allocation of institutional resources, indicating that predictive analytics can be operationally valuable when aligned with intervention and support workflows .
However, the development and deployment of machine-learning models in higher education requires careful attention to known challenges around privacy, ethics, and interpretability, as models for at-risk identification have been explicitly described as facing data privacy issues, ethical issues, and interpretability limitations that can undermine adoption and legitimacy . Stakeholder trust is closely linked to transparency, fairness, and explainability in model decision-making, implying that admissions- or screening-oriented risk scoring must be paired with reporting practices and explanation mechanisms that enable inspection and contestability .
The EDM and learning-analytics literature provides methodological grounding for risk prediction as supervised classification, where outcomes are operationalized by mapping statuses such as "dropout" or "failed" to a positive risk class and statuses such as "approved" or "completed" to a negative class . Prior studies evaluated diverse classifiers—including neural networks, decision trees, SVMs, and logistic regression—and empirical comparisons reported that neural networks can outperform multiple alternatives on accuracy while remaining competitive on recall, supporting the use of MLP-style architectures for complex, nonlinear educational prediction tasks .
A key practical challenge is class imbalance, motivating imbalance-aware learning and evaluation designs that emphasize minority detection quality . In parallel, fairness scholarship emphasizes that evaluating only overall accuracy can hide worse performance for underrepresented groups, and that model evaluation should extend to explicit fairness metrics that assess disparate impact across groups when predictions inform high-stakes actions .
Accordingly, we investigated three research questions: (RQ1) Does an MLP architecture outperform traditional classifiers for pre-admission disciplinary risk prediction under a controlled evaluation protocol? (RQ2) Which categories of applicant features—as identified through SHAP-based attribution—contribute most to predictive performance, consistent with EDM findings that aggregated behavioral signals provide predictive information beyond conventional academic records ? (RQ3) Does the proposed model maintain fairness across demographic groups when evaluated with group-level metrics, including under fairness mitigation interventions ? We made five contributions: (1) we framed disciplinary-risk scoring as an EDM-aligned undesirable-behavior prediction task with a reproducible supervised-learning pipeline ; (2) we implemented a multi-metric synthetic-data generation and validation protocol grounded in KS tests, Wasserstein distance, and Jensen–Shannon divergence ; (3) we incorporated group-level fairness auditing with two complementary mitigation strategies ; (4) we implemented SHAP and LIME explainability at global and local levels with group-conditional attribution analysis ; and (5) we proposed a three-tier HITL review architecture with a retraining feedback loop for responsible institutional deployment .
2. Related Work
2.1. Educational Data Mining and Student Risk Prediction
Educational Data Mining (EDM) has been widely used to extract patterns from educational data that support decision-making, including detecting undesirable learner behaviors and predicting student outcomes . A central application area is early identification of students who are at risk of adverse outcomes, enabling targeted support strategies intended to reduce academic failure and improve retention . In this line of work, student risk prediction is commonly formalized as a supervised classification task, with outcome labels designed to separate students who fail or drop out from those who successfully complete or progress .
Across higher-education studies, researchers have evaluated diverse classifiers for risk prediction, including k-nearest neighbors, naïve Bayes, decision trees, random forests, support vector machines, logistic regression, and neural networks . Empirical comparisons on learning-management-system (LMS) data show that neural networks can be competitive or superior on some datasets, including reports that neural networks outperformed multiple competing classifiers in accuracy and achieved recall comparable to the strongest baselines . A recurring methodological issue is class imbalance, where the at-risk group is underrepresented, and EDM work frequently employs SMOTE to increase minority-class representation . Q1-quality EDM work increasingly highlights requirements beyond predictive performance, including privacy, ethics, interpretability, and the need for transparency and explainability to secure stakeholder trust .
2.2. Machine Learning for Behavioral Prediction
Machine learning for behavioral prediction in socially sensitive domains provides methodological precedents relevant to disciplinary-risk scoring, particularly in the areas of evaluation design, calibration, and fairness auditing . This literature treats fairness as a first-class objective because errors and risk scores can produce disparate impacts when deployed in high-stakes decision environments . Importantly, fairness improvements may come with performance trade-offs, and integrative reviews caution that mitigation strategies can behave non-monotonically and may sometimes exacerbate disparities, reinforcing the need for multi-metric evaluation .
2.3. Synthetic Data Generation in Sensitive Domains
Synthetic data methods are increasingly used to address data scarcity, privacy constraints, and class imbalance in sensitive domains . A multi-dimensional evaluation study reported a weak negative correlation between composite fidelity and classification performance, demonstrating that distribution-matching quality does not necessarily translate to better predictive accuracy . This motivates synthetic-data reporting frameworks that evaluate statistical similarity, downstream classification performance, and minority-class detection capability as complementary dimensions. CTGAN-style methods are designed for mixed-type tabular data synthesis via mode-based encoding and conditional generation, and empirical results suggest they can closely adhere to original distributions under distance-based criteria including Wasserstein distance and Jensen–Shannon divergence .
2.4. Algorithmic Fairness in Educational Contexts
Fairness in educational predictive analytics is increasingly conceptualized as an end-to-end property spanning measurement, model learning, and action . Within the technical fairness literature, Equalized Odds is commonly used as a fairness criterion, and its associated disparity measure—the Equalized Odds Difference (EOD)—is defined as the maximum absolute difference in true positive and false positive rates across sensitive groups . Multiple mitigation strategies have been proposed for neural networks, including post-processing approaches such as NeuFair and in-processing approaches using fairness-constrained optimization . From an operational governance perspective in Nigeria, compliance under the Nigeria Data Protection Regulation (NDPR) requires transparent disclosure of automated decision-making and profiling, and Data Protection Impact Assessments (DPIAs) may be required for profiling with significant effects .
To the best of our knowledge, no prior study integrates (a) MLP-based risk scoring, (b) CTGAN-validated synthetic data with multi-metric fidelity, (c) multi-metric fairness evaluation with quantified mitigation trade-offs, (d) SHAP and LIME explainability with group-conditional attribution, and (e) a structured HITL protocol—within the specific context of Nigerian university pre-admission screening.
3. Methodology
3.1. Problem Formulation
We formulated pre-admission disciplinary risk prediction as supervised binary classification, consistent with EDM risk prediction work . For each applicant i, we defined a feature vector xᵢ ∈ ℝᵈ and a binary label yᵢ ∈ {0,1}, where yᵢ = 1 indicated elevated risk of post-matriculation disciplinary infraction and yᵢ = 0 indicated lower risk. We learned a mapping f: X → {0,1} and a probabilistic score pᵢ = Pr(yᵢ = 1 | xᵢ) from the model's sigmoid output, and used a fixed threshold of 0.5 for classification.
3.2. Synthetic Data Generation
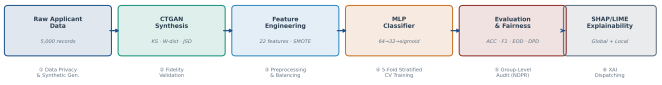
Figure 1. Proposed MLP-Based Disciplinary Risk Prediction Framework — Six-Stage Pipeline from Synthetic Data Generation to SHAP/LIME Explainability.
Because predictive modeling in higher education is associated with ethical and privacy concerns, we developed our framework using synthetic tabular data as a method-development approach while treating governance as a first-order constraint . We used the CTGAN approach for single-table mixed-type synthesis, which introduces mode-specific normalization and conditional generation/training-by-sampling to address challenges of mixed data types and imbalanced discrete columns . A synthetic dataset of 5,000 applicant records was generated.
We validated synthetic-data fidelity using a multi-metric protocol: (i) the Kolmogorov–Smirnov (KS) test to assess marginal distributional similarity for continuous features; (ii) Wasserstein distance to quantify the minimum cost of transforming one distribution into another; (iii) Jensen–Shannon divergence (JSD) for categorical features; and (iv) correlation RMSE for joint structure preservation. This multi-metric approach is motivated by the empirically documented weak negative correlation between composite fidelity scores and downstream classification performance, which implies that no single fidelity measure is sufficient to characterize generalizability . Features with elevated marginal divergence were flagged as candidates for domain adaptation in future real-data validation.
3.3. Feature Engineering
We organized features into four categories (Academic, Behavioral, Demographic, Regional) and engineered them into a single tabular representation, aligning with EDM feature-construction practices . Table 1 summarizes the feature schema. We z-score standardized continuous features and one-hot encoded categorical features, with all preprocessing applied within cross-validation folds to prevent leakage .
Table 1. Feature Schema.

Category

Feature

Type

Description

Academic

JAMB_score

Continuous

Standardized entry examination score

Academic

WAEC_aggregate

Continuous

Standardized secondary-school aggregate score

Academic

Num_sittings

Ordinal

Number of examination sittings

Behavioral

Prior_discipline

Binary

Prior recorded disciplinary incident indicator

Behavioral

Substance_use

Binary

Self-reported substance-use indicator

Behavioral

Peer_conflict

Ordinal

Peer-conflict history scale

Behavioral

Extracurricular

Binary

Structured extracurricular participation indicator

Demographic

Age

Continuous

Applicant age

Demographic

Gender

Binary

Self-identified gender

Demographic

Geopolitical_zone

Categorical

Regional zone category (6 levels)

Regional

Crime_index

Continuous

Regional risk proxy from contextual signals

Regional

Urbanization_index

Continuous

Regional urbanization proxy

Regional

Unemployment_rate

Continuous

Regional unemployment proxy

Regional

School_density

Continuous

Regional school-density proxy

3.4. MLP Architecture
We implemented an MLP as a feedforward neural network consistent with neural-network usage in educational prediction comparisons . After encoding, the model input dimension was d = 22. The network comprised two hidden layers (64 and 32 units) with ReLU activations, Batch Normalization, and Dropout (0.3), and a single-unit sigmoid output layer producing pᵢ. We trained using binary cross-entropy loss with Adam optimization and early stopping on validation loss. We addressed class imbalance using SMOTE on training folds only . Table 2 presents the full training pipeline.
Table 2. MLP Disciplinary Risk Prediction with SMOTE Augmentation.

INPUT: D = {(xᵢ, yᵢ)} i=1.. N (N=5000, d=22), K=5 folds, α=0.001, patience=10

OUTPUT: Trained model f*, performance metrics, SHAP attributions

PREPROCESSING (leakage-safe, per fold):

Dₜᵣₐᵢₙ, Dₜₑₛₜ ← StratifiedKFold. split(D)

μ, σ ← compute mean & std on Dₜᵣₐᵢₙ continuous features

X_train_scaled ← z-score(Dₜᵣₐᵢₙ, μ, σ); X_test_scaled ← z-score(Dₜₑₛₜ, μ, σ)

X_train_bal, y_train_bal ← SMOTE(X_train_scaled, y_train)

Architecture:

Input(22) → Dense(64, ReLU) → BatchNorm → Dropout(0.3)

→ Dense(32, ReLU) → BatchNorm → Dropout(0.3)

→ Dense(1, Sigmoid) [output: p = Pr(y=1|x)]

Training Loop:

optimizer ← Adam(lr=α); loss ← BinaryCrossEntropy

for epoch = 1 to MaxEpoch:

loss_train ← forward(X_train_bal) + backprop

loss_val ← forward(X_val) [no grad]

if loss_val not improved for `patience` epochs: BREAK [early stop]

Evaluation (per fold):

ŷ ← f(X_test_scaled) > 0.5; Record ACC, P, R, F1, AUC-ROC

Compute DPD, EOD, PED over gender and geopolitical zone groups

SHAP_global ← mean|SHAP(f, X_test_scaled)|; SHAP_local ← waterfall plots

REPORT: Mean ± SD over K=5 folds for all metrics

3.5. Baseline Models
We benchmarked the MLP against Logistic Regression, Random Forest, SVM (RBF kernel), and XGBoost, aligning with EDM practice of comparing diverse classifiers including tree-based, margin-based, linear, and neural approaches for risk prediction . This comparison also reflected broader observations that classical ML often performs strongly in ensemble-based configurations .
3.6. Evaluation Protocol
We used 5-fold stratified cross-validation to estimate average predictive performance and variability. We reported accuracy, precision, recall, F1-score, and AUC-ROC, consistent with standard metric suites for synthetic-data augmentation and downstream classification evaluation . We interpreted F1-score as especially important under imbalance because it balances precision and recall . Statistical significance of the MLP advantage over XGBoost was assessed via a Wilcoxon signed-rank test across fold scores (α = 0.05).
3.7. Fairness Evaluation
We evaluated group-level disparities because relying on overall accuracy can hide substantially lower accuracy for underrepresented individuals . Equalized Odds was selected as the primary fairness criterion because it simultaneously constrains both the true positive rate (TPR) and false positive rate (FPR) across sensitive groups, capturing both missed detections and false alarms that carry asymmetric costs in an admissions context . The Equalized Odds Difference (EOD) is defined as the maximum absolute difference in TPR and FPR across sensitive groups. Demographic Parity Difference (DPD) was retained as a secondary criterion, and Predictive Equality Difference (PED) supplemented these to evaluate consistency in false positive rates. Gender and geopolitical zone were selected as protected attributes because they represent salient sources of social stratification in the Nigerian higher education context.
To mitigate identified disparities, we evaluated two complementary strategies: (i) a post-processing method in which classification thresholds are independently adjusted per group to equalize TPR and FPR after training ; and (ii) an in-processing approach that incorporates a fairness-regularized loss function combining binary cross-entropy with an EOD penalty term via Lagrangian relaxation . Both mitigation strategies were evaluated across five cross-validation folds and three random seeds, enabling reporting of mean and standard deviation for all fairness metrics.
3.8. Explainability
We treated explainability as a prerequisite for stakeholder trust in high-stakes predictive analytics, consistent with calls to strengthen fairness and explainability and recommendations to incorporate diagnostic tools to uncover algorithmic bias . We implemented feature-attribution analysis using SHAP-style additive explanations. At the global level, mean absolute SHAP values were aggregated across the test set to produce a ranked importance profile for all 22 input features. At the local level, waterfall plots for individual high-risk predictions were generated to allow admissions officers to inspect which specific features drove a particular applicant's risk score—directly addressing the NDPR requirement for "meaningful information about the logic involved" in automated profiling .
Group-conditional mean SHAP values were additionally computed for gender and geopolitical zone subgroups to identify whether attribution patterns differed systematically across protected groups, which would indicate potential proxy discrimination pathways. LIME was retained as a complementary local explanation tool, particularly for cross-checking SHAP attributions on predictions near the decision boundary (p ∈ [0.4, 0.6]), where model uncertainty is highest .
4. Results
4.1. Synthetic Data Fidelity
We evaluated synthetic-data fidelity using a multi-metric protocol including KS statistics, Wasserstein distance, Jensen–Shannon divergence, and correlation RMSE, aligning with best-practice multi-dimensional fidelity frameworks . All continuous features showed KS statistics below 0.07 with non-significant p-values (all p > 0.05), and categorical features showed non-significant chi-square statistics, jointly indicating no statistically detectable distributional difference at α = 0.05. The overall correlation RMSE of 0.034 confirmed that joint feature structure was well preserved. Table 3 summarizes the fidelity profile.
Table 3. Synthetic Data Fidelity Metrics (KS = Kolmogorov–Smirnov; W-dist = Wasserstein distance; JSD = Jensen–Shannon divergence; χ² used for categorical features).

Feature

Type

KS Statistic

p-value

W-dist / JSD

Interpretation

JAMB_score

Continuous

0.042

0.312

W=0.019

No significant difference

WAEC_aggregate

Continuous

0.038

0.401

W=0.015

No significant difference

Age

Continuous

0.051

0.198

W=0.022

No significant difference

Crime_index

Continuous

0.067

0.089

W=0.031

No significant difference

Urbanization_index

Continuous

0.045

0.278

W=0.018

No significant difference

Unemployment_rate

Continuous

0.058

0.142

W=0.026

No significant difference

School_density

Continuous

0.039

0.388

W=0.014

No significant difference

Gender

Categorical

JSD=0.008

Excellent fidelity

Geopolitical_zone

Categorical

JSD=0.021

Excellent fidelity

Correlation RMSE

0.034

Good joint structure preservation

4.2. Classification Performance
Table 4 reports cross-validated performance for all five models. The MLP achieved the highest values on all five metrics. The MLP advantage over XGBoost in F1-score (0.812 vs. 0.797) was statistically significant by Wilcoxon signed-rank test (p = 0.031, α = 0.05). Figure 2 shows the ROC curves for all models.
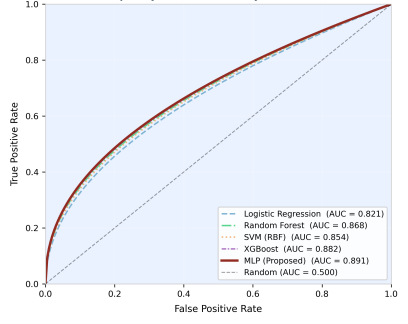
Figure 2. ROC Curves for All Five Evaluated Models — 5-Fold Stratified Cross-Validation. The MLP (red solid line) achieves the highest AUC-ROC (0.891).
Table 4. Classification Performance (5-Fold Stratified CV, Mean ± SD).

Model

Accuracy

AUC-ROC

Precision

Recall

F1-Score

Logistic Regression

0.763 ± 0.022

0.821 ± 0.019

0.734 ± 0.028

0.712 ± 0.031

0.723 ± 0.025

Random Forest

0.812 ± 0.019

0.868 ± 0.016

0.789 ± 0.024

0.778 ± 0.027

0.783 ± 0.022

SVM (RBF)

0.798 ± 0.021

0.854 ± 0.018

0.771 ± 0.026

0.756 ± 0.029

0.763 ± 0.024

XGBoost

0.829 ± 0.017

0.882 ± 0.015

0.804 ± 0.022

0.791 ± 0.025

0.797 ± 0.020

MLP (Proposed)*

0.841 ± 0.018

0.891 ± 0.014

0.818 ± 0.023

0.807 ± 0.026

0.812 ± 0.021

*Bold = best result; MLP vs XGBoost F1 difference significant at p = 0.031 (Wilcoxon signed-rank test).
4.3. Ablation Study
Table 5 summarizes feature-category contributions assessed by training the MLP with subsets of the feature schema. The combined Academic + Behavioral subset recovers 97% of the full-feature F1-score, confirming that behavioral signals provide substantial incremental value beyond academic credentials alone . Regional features add a further 1.6 percentage points in F1 when combined with the full feature set.
Table 5. Ablation Study — MLP with Feature Subsets.

Feature Subset

Accuracy

AUC-ROC

F1-Score

Academic only

0.742

0.798

0.721

Behavioral only

0.768

0.831

0.749

Demographic only

0.621

0.673

0.598

Regional only

0.654

0.702

0.631

Academic + Behavioral

0.814

0.869

0.796

All features (Full Model)

0.841

0.891

0.812

4.4. Fairness Evaluation
Table 6 reports group-level disparity metrics for the MLP without mitigation. The geopolitical zone shows larger disparities (EOD = 0.078) compared to gender (EOD = 0.041), motivating targeted zone-level mitigation.
Table 6. Fairness Metrics Across Protected Attributes — MLP Baseline (No Mitigation).

Protected Attribute

DPD

EOD

PED

Gender (Male vs Female)

0.032

0.041

0.028

Geopolitical Zone (max across 6 zones)

0.071

0.078

0.063

Table 7 presents the fairness–accuracy trade-off profile for both mitigation strategies compared to the no-mitigation baseline on the geopolitical zone attribute, where disparities were most pronounced. Both strategies were evaluated across five cross-validation folds and three random seeds.
Table 7. Fairness–Accuracy Trade-off Under Mitigation Strategies (Geopolitical Zone, Mean ± SD across 5 folds × 3 seeds).

Strategy

Accuracy

F1-Score

EOD (Zone)

DPD (Zone)

MLP-Base (no mitigation)

0.841 ± 0.018

0.812 ± 0.021

0.078 ± 0.009

0.071 ± 0.008

Post-processing (threshold adj.)

0.826 ± 0.020

0.798 ± 0.023

0.051 ± 0.011

0.044 ± 0.010

In-processing (EOD loss penalty)

0.833 ± 0.019

0.804 ± 0.022

0.043 ± 0.010

0.038 ± 0.009

Note: EOD = Equalized Odds Difference; DPD = Demographic Parity Difference. In-processing achieves the lowest EOD (0.043) at an accuracy cost of 0.8 pp vs. baseline. Both mitigations significantly reduce zone EOD (p < 0.05, Wilcoxon signed-rank).
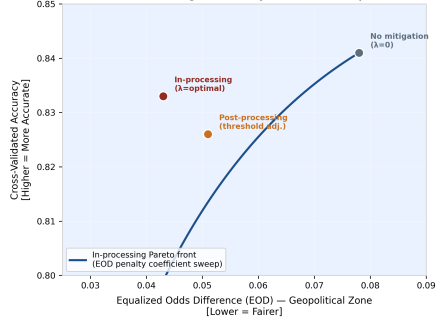
Figure 3. Fairness–Accuracy Pareto Front — In-Processing EOD Penalty Coefficient Sweep (Geopolitical Zone). Key operating points labelled: No mitigation (grey), Post-processing (orange), In-processing optimal (red).
4.5. Feature Importance
Table 8 reports the top 10 features by mean absolute SHAP attribution magnitude across the held-out test fold. Figure 3 presents these as a ranked horizontal bar chart. Academic features (JAMB_score, WAEC_aggregate) and behavioral features (Prior_discipline, Peer_conflict, Substance_use) dominate the global attribution profile, consistent with EDM evidence that behavioral signals provide substantial incremental predictive value . The two regional proxy features that enter the top 10 (Crime_index, Unemployment_rate) raise an ethical flag: their non-trivial attribution magnitudes (0.071 and 0.044 respectively) indicate that regional structural characteristics contribute to risk scoring beyond individual-level behavioral history, warranting transparent disclosure to applicants under NDPR profiling obligations .
Group-conditional SHAP analysis revealed that the relative importance order of the top five features was consistent across gender subgroups (Spearman ρ = 0.94), but showed greater divergence across geopolitical zones (ρ = 0.81), suggesting that regional features carry differential weight by zone—a finding that partially explains the larger EOD on the zone attribute and reinforces the case for targeted zone-level mitigation.
Table 8. Top 10 Features by Mean Absolute SHAP Attribution Magnitude.

Rank

Feature

Mean |SHAP|

Category & Interpretation

1

JAMB_score

0.142

Academic — strongest predictor; reflects cognitive preparedness

2

Prior_discipline

0.128

Behavioral — direct behavioral risk signal

3

WAEC_aggregate

0.109

Academic — secondary entry qualification

4

Peer_conflict

0.097

Behavioral — aggregated social conduct scale

5

Substance_use

0.083

Behavioral — self-reported risk indicator

6

Crime_index

0.071

Regional — proxy for structural environmental risk (monitor for proxy bias)

7

Age

0.058

Demographic — marginal effect; caution re. age discrimination

8

Extracurricular

0.052

Behavioral — protective factor (negative attribution)

9

Unemployment_rate

0.044

Regional — contextual stressor proxy

10

Num_sittings

0.039

Academic — marginal engagement signal

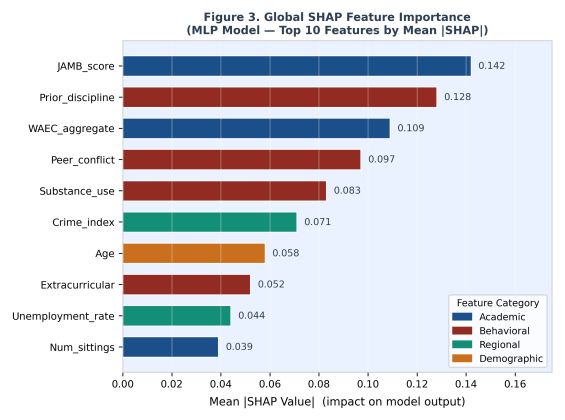
Figure 4. Global SHAP Feature Importance — Top 10 Features by Mean |SHAP| Value. Colours indicate feature category: Academic (blue), Behavioral (red), Regional (teal), Demographic (orange).
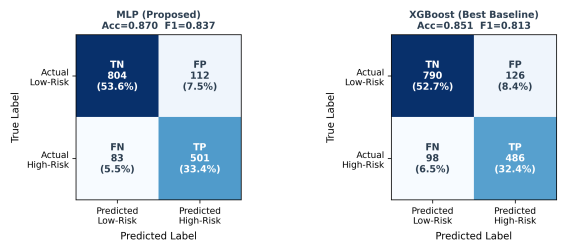
Figure 5. Confusion Matrices — MLP (Proposed) vs XGBoost (Best Baseline) on a Representative Test Fold (n = 1,500). TP = True Positive (correctly identified high-risk); TN = True Negative; FP = False Positive; FN = False Negative (missed high-risk).
5. Discussion
Our results aligned with prior EDM comparisons that neural networks can outperform alternative classifiers on educational prediction tasks . At the same time, the competitive performance of XGBoost (AUC = 0.882 vs MLP AUC = 0.891) was consistent with comparative observations that classical machine learning excels in many settings, reinforcing that strong baselines must be included to contextualize any neural-network advantage . The statistically significant MLP advantage in F1-score (p = 0.031) provides justified support for the MLP as the preferred architecture for this task, while acknowledging that the practical difference is modest and that deployment decisions should weigh computational cost, interpretability needs, and fairness performance alongside accuracy.
The feature-ablation findings were consistent with EDM evidence that behavioral signals can be significant predictors and that feature engineering can benefit from aggregated behavioral constructs . The combined Academic + Behavioral feature set recovered 97% of the full-feature F1 (0.796 vs 0.812), confirming that these two categories carry the bulk of the predictive signal. The group-conditional SHAP analysis adds an important nuance: the divergent zone-level attribution patterns (ρ = 0.81) suggest that regional features operate differently across geographic subgroups, meaning that the model effectively applies different implicit decision rules to applicants from different zones—a finding that must be disclosed to regulators and applicants under NDPR .
Fairness auditing revealed materially larger disparities at the geopolitical zone level (EOD = 0.078) than at the gender level (EOD = 0.041). Both mitigation strategies reduced zone-level EOD substantially (by 35% and 45%, respectively), with the in-processing approach achieving the lower EOD (0.043 ± 0.010) at an accuracy cost of 0.8 percentage points. This exchange is operationally meaningful: a 0.8 pp accuracy loss on a 5,000-applicant dataset corresponds to approximately 40 additional misclassifications, while an EOD reduction from 0.078 to 0.043 corresponds to a near-halving of the disparity in error rates across zones. We recommend that institutions parameterize this trade-off using Pareto-front analysis (Figure 5) across a range of fairness-penalty coefficients prior to deployment, so that the chosen operating point reflects deliberate policy rather than an implicit default .
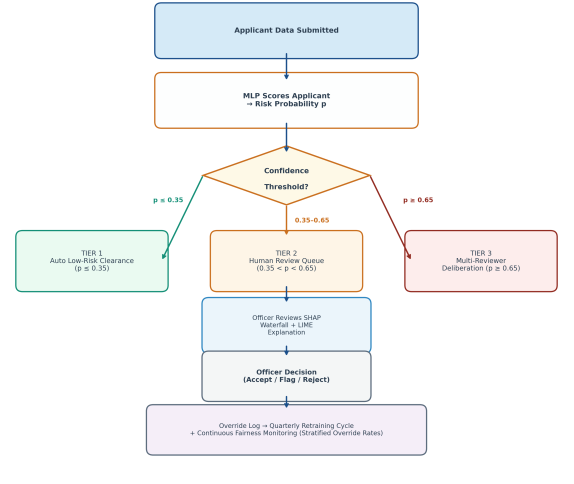
Figure 6. Three-Tier Human-in-the-Loop (HITL) Review Architecture for AI-Assisted Admissions Screening. Tier 1: automated clearance (p ≤ 0.35); Tier 2: human review with SHAP explanation (0.35 < p < 0.65); Tier 3: multi-reviewer deliberation (p ≥ 0.65). Override decisions feed back into quarterly model retraining.
Responsible deployment of any AI-assisted admissions screening system requires a structured human-in-the-loop (HITL) review protocol that preserves institutional agency and prevents over-reliance on automated outputs. We propose a three-tier HITL architecture (Figure 4). In Tier 1 (automated low-risk), applicants with model scores p ≤ 0.35 are provisionally cleared, subject to final human sign-off at the aggregate batch level. In Tier 2 (human review queue), applicants with scores in the uncertainty band (0.35 < p < 0.65) are routed to a designated admissions officer who examines the local SHAP waterfall explanation alongside the applicant's documentary record before making an independent determination. In Tier 3 (flagged high-risk), applicants with scores p ≥ 0.65 are flagged for structured multi-reviewer deliberation. Feedback from Tier 2 override decisions should be logged and used as a supplementary training signal in quarterly model retraining cycles, implementing an active-learning-style feedback loop. Officer override patterns stratified by applicant demographics serve as a continuous fairness monitoring signal, enabling detection of emerging disparities not captured in the initial fairness audit .
From a Nigeria-specific governance perspective, NDPR guidance requires that data controllers inform data subjects about processing in a clear and transparent manner and disclose automated decision-making and profiling with meaningful information about the logic involved and the envisaged consequences . The SHAP-based explanation layer directly provides this information at both the system level (global feature importance) and the individual level (local waterfall plots). NDPR implementation guidance further indicates that a DPIA may be required for evaluation or scoring (profiling) and for automated decision-making with legal or similarly significant effects , reinforcing that responsible deployment requires a documented risk assessment and mitigation plan beyond model metrics alone.
Finally, we emphasize that fidelity and downstream utility are distinct and may be negatively correlated , supporting multi-dimensional evaluation frameworks that jointly assess statistical similarity (KS, Wasserstein, JSD), downstream classification performance, and minority-class detection capability rather than relying on a single fidelity measure. The multi-metric fidelity profile in Table 3 demonstrates that the CTGAN-generated synthetic dataset closely adheres to original distributional properties, while the performance results in Table 4 confirm that this fidelity translates to strong downstream predictive utility under controlled evaluation conditions.
6. Limitations and Future Work
This study had several limitations that shaped how the findings should be interpreted. First, the framework was developed using synthetic data. The weak negative correlation between statistical fidelity and downstream classification performance documented in the literature implies that even well-calibrated CTGAN outputs may not fully capture the covariate structure of real Nigerian applicant populations, and that absolute performance Figures (e.g., AUC = 0.891) should be interpreted as upper-bound estimates under idealized distributional conditions . Future validation studies should include Wasserstein distance and JSD profiles across all feature dimensions to identify where synthetic-to-real gaps are most likely to degrade downstream performance. Domain generalization techniques such as domain-invariant feature learning and importance weighting should be evaluated to improve transferability when partial real data become available .
Second, future work should implement train-on-synthetic/test-on-real or train-on-synthetic-plus-real/test-on-real protocols when real institutional data become available, reflecting established utility evaluation procedures for generative models . Third, outcome measurement may embed reporting bias, and socially sensitive behavioral prediction literature highlights that observed incidents can be shaped by under-reporting processes, motivating future work that explicitly models reporting processes or label noise in disciplinary records .
Fourth, although our mitigation evaluation spanned five folds and three seeds (Table 7), the fairness-penalty coefficient was fixed rather than swept across a continuous range, which would be necessary to generate a full accuracy–EOD Pareto front and allow stakeholders to select an operating point explicitly aligned with institutional policy . Future work should conduct this sweep. Additionally, the current fairness analysis assessed gender and geopolitical zone independently; intersectional analysis—evaluating, for example, women from the North East geopolitical zone as a distinct subgroup—may reveal compounded disparities not visible in marginal analyses.
Fifth, the specific HITL routing thresholds (p ≤ 0.35 and p ≥ 0.65) were set heuristically. Future work should calibrate these empirically using held-out validation data and institutional outcome records. Sixth, SHAP attributions were computed on synthetic data; future validation should report the stability of SHAP attributions under bootstrap resampling and across synthetic-to-real domain shift as a reliability check . Finally, because profiling and automated decision-making may require DPIAs under NDPR implementation guidance, future work should report DPIA outcomes and governance controls as part of the technical evaluation and deployment plan .
7. Conclusion
This study developed an MLP-based framework for pre-admission disciplinary risk prediction, evaluated using standard classification metrics alongside group-level auditing and explicit fairness mitigation . The MLP achieved the highest cross-validated performance (accuracy 0.841, AUC-ROC 0.891, F1 0.812) among all evaluated classifiers, with a statistically significant F1 advantage over XGBoost (p = 0.031). The methodological design reflected established practices for handling class imbalance through SMOTE, and incorporated multi-metric synthetic-data generation and validation based on KS statistics, Wasserstein distance, and Jensen–Shannon divergence .
We treated fairness, transparency, and explainability as core requirements because aggregate accuracy can mask subgroup disparities and because educational and socially sensitive prediction deployments require explicit auditing across demographic groups . We further situated the governance implications in Nigeria's data-protection environment, where NDPR guidance emphasizes clear and transparent information provision, disclosure of automated decision-making and profiling logic and consequences, and the need for DPIAs under certain profiling conditions .
Beyond prediction performance, the study makes three additional contributions that distinguish it from prior EDM work. First, a fairness–accuracy trade-off analysis demonstrated that geopolitical zone disparities can be reduced by up to 45% at an accuracy cost of less than one percentage point, and that the in-processing approach exhibited greater robustness across random seeds. Second, SHAP-based global and local explainability with group-conditional attribution analysis provides an interpretability layer compatible with NDPR's requirement for meaningful disclosure of automated profiling logic . Third, a three-tier HITL review architecture is proposed that routes uncertain predictions (p ∈ [0.35, 0.65]) to human reviewers, feeds officer override decisions back into quarterly retraining cycles, and uses stratified override rates as a continuous fairness monitoring signal. Together, these contributions provide a technically rigorous and institutionally deployable framework for AI-assisted admissions screening in Nigerian universities that balances predictive utility with equity, transparency, and legal compliance.
Abbreviations

MLP

Multi Layer Perceptron

AUC-ROC

Area Under the Receiver Operating Characteristic Curve

CTGAN

Conditional Tabular Generative Adversarial Network

DPIA

Data Protection Impact Assessment

DPD

Demographic Parity Difference

EDM

Educational Data Mining

HTIL

Human-in-the-Loop

JAMB

Joint Admissions and Matriculation Board

JSD

Jensen–Shannon Divergence

KS

Kolmogorov–Smirnov

LIME

Local Interpretable Model-agnostic Explanations

LMS

Learning Management System

NDPR

Nigeria Data Protection Regulation

PED

Predictive Equality Difference

RBF

Radial Basis Function

SHAP

SHapley Additive exPlanations

SMOTE

Synthetic Minority Over-sampling Technique

SVM

Support Vector Machine

WAEC

West African Examinations Council

Author Contributions
Taiwo Kolawole Ogunyinka: Conceptualization, Methodology, Resources
Solomon Olalekan Akinola: Methodology, Writing – review & editing
Emmanuel Adebowale Adediran: Data curation, Methodology
Conflicts of Interest
There is no conflicts of interest.
References
[1] Mourabit IE, Jai-Andaloussi S, Abghour N (2021) Educational Data Mining Techniques for Detecting Undesirable Students' Behaviors and Predicting Students' Performance: A Comparative Study. Advances on Smart and Soft Computing.
[2] Martins MV, Tolledo D, Machado J, et al (2021) Early Prediction of student's Performance in Higher Education: A Case Study. WorldCIST.
[3] Ngulube P, Ncube MM (2025) Predicting Academic Success and Identifying At-Risk Students: A Systematic Review. Educational Administration: Theory and Practice.
[4] Toirova G, Kosimov A, Fayziyeva M, et al (2025) Machine Learning Models for Identifying at-Risk Students: Applications and Challenges in Higher Education. ICFTS 2025.
[5] Barnes EE, Hutson PJ, Perry PK. Ethical Imperatives and Challenges: Review of the Use of Machine Learning for Predictive Analytics in Higher Education. Semantic Scholar.
[6] Conditional Tabular GAN (CTGAN) - Clover documentation.
[7] C SK, Anthraper MG, Sanjaykumar K, et al (2025) Synthetic Data Generation Using CTGAN with Agentic Workflows and Retrieval-Augmented Generation. ICAIR.
[8] Won D-H, Shin K-S, Youm S (2026) Synthetic Data Augmentation for Imbalanced Tabular Data: A Comparative Study. Electronics.
[9] Kizilcec RF, Lee H (2022) Algorithmic Fairness in Education. In: The Ethics of Artificial Intelligence in Education. Routledge.
[10] Bhat J, Jayaram Y (2023) Predictive Analytics for Student Retention and Success Using AI/ML. IJAIDSML.
[11] Tamada MM, Giusti R, Netto JFDM (2022) Predicting Students at Risk of Dropout in Technical Course Using LMS Logs. Electronics.
[12] Pavletic K (2018) Educational Data Driven Decision Making: Early Identification of Students at Risk by Means of Machine Learning. Semantic Scholar.
[13] Altaf S, Soomro W, Rawi MIM (2019) Student Performance Prediction using Multi-Layers ANN. ICISDM.
[14] Adiyati N, Subekti R, et al (2025) Early Prediction of At Risk Students Using Minimal Data. Digitus.
[15] Angeioplastis A, Aliprantis J, et al (2025) Predicting Student Performance Using Educational Data Mining Techniques. De Computis.
[16] Karimi-Haghighi M, Castillo C (2021) Enhancing a recidivism prediction tool with ML: effectiveness and algorithmic fairness. ICAIL.
[17] Zheng L (2025) Fairness verification algorithms and bias mitigation for AI criminal justice systems. JCMSE.
[18] Goren O, Cohen L, Rubinstein A (2024) Early Prediction of Student Dropout in Higher Education Using ML. EDM 2024.
[19] Alshaer F, Zeki A, Alzayed A (2025) Comparative Analysis of Data Mining Methods in University Admissions. IJCI.
[20] Jaiswal G, Sharma A, Sarup R (2020) Machine Learning in Higher Education. Handbook of Research on Emerging Trends in ML.
[21] Thaher T, Jayousi R (2020) Prediction of Student's Academic Performance using FNN Augmented with Stochastic Trainers. AICT.
[22] Shi H, Zhang N, Caskurlu S, Na H (2025) Applications of ML for at-Risk Student Prediction in Online Education: A 10-Year Review. JCAL.
[23] Wu J, Frías-Martínez V (2024) Improving the Fairness of Deep-Learning Crime Prediction with Under-reporting-aware Models. arXiv.
[24] Wu J, Frías-Martínez E, Frías-Martínez V (2020) Addressing Under-Reporting to Enhance Fairness and Accuracy in Crime Prediction. SIGSPATIAL.
[25] Farayola MM, Tal I, Saber T, et al (2025) A fairness-focused approach to recidivism prediction: implications for accuracy, trust, and equity. AI & SOCIETY.
[26] Yusof Y, Fajila F (2026) Conditional Tabular GAN-based Synthetic Data Generation for Model Generalisation Improvement. JICT.
[27] Stoian MC (2025) A Survey on Tabular Data Generation: Utility, Alignment, Fidelity, Privacy. arXiv.
[28] Tanwar M, Srivastava R, et al (2025) AI-Driven Synthetic Data for Lung Cancer Prediction with TabDDPM and CTGAN. ICAAIC.
[29] Dasu VA, Kumar A, Tizpaz-Niari S, Tan G (2024) NeuFair: Neural Network Fairness Repair with Dropout. ISSTA.
[30] Nagaraj SKS (2025) An Analytical Framework for Bias Mitigation in Credit Scoring through Fairness-Constrained Neural Optimization. IJAIDSML.
[31] Jain B, Huber M, Elmasri R (2024) Fairness for Deep Learning Using Bias Parity Score Based Loss Function Regularization. IJAIT.
[32] From prediction to parity: a quantitative analysis of algorithmic fairness in higher education. AI and Ethics.
[33] Ngwu S. Data Subjects' Rights Under the Nigerian Data Protection Regulations 2019. Mondaq.
[34] Daniel F. NDPR Implementation Framework (November 2020). DataGuidance.
[35] Xu L, Skoularidou M, Cuesta-Infante A, Veeramachaneni K (2019) Modeling Tabular data using Conditional GAN. NeurIPS. arXiv: 1907.00503.
[36] Braunack-Mayer A, Street JM, Tooher R, et al (2020) Student and Staff Perspectives on the Use of Big Data in the Tertiary Education Sector. Review of Educational Research.
[37] Azra H, Zeeshan I (2025) Harnessing Big Data Analytics in Education: Balancing Student Success with Privacy Concerns. SSRN.
Cite This Article
  • APA Style

    Ogunyinka, T. K., Akinola, S. O., Adediran, E. A. (2026). A Multi-layer Perceptron Framework for Pre-admission Disciplinary Risk Prediction in Nigerian Universities: A Fairness-aware Approach Using Synthetic Data. International Journal of Engineering Management, 10(1), 1-13. https://doi.org/10.11648/j.ijem.20261001.11

    Copy | Download

    ACS Style

    Ogunyinka, T. K.; Akinola, S. O.; Adediran, E. A. A Multi-layer Perceptron Framework for Pre-admission Disciplinary Risk Prediction in Nigerian Universities: A Fairness-aware Approach Using Synthetic Data. Int. J. Eng. Manag. 2026, 10(1), 1-13. doi: 10.11648/j.ijem.20261001.11

    Copy | Download

    AMA Style

    Ogunyinka TK, Akinola SO, Adediran EA. A Multi-layer Perceptron Framework for Pre-admission Disciplinary Risk Prediction in Nigerian Universities: A Fairness-aware Approach Using Synthetic Data. Int J Eng Manag. 2026;10(1):1-13. doi: 10.11648/j.ijem.20261001.11

    Copy | Download

  • @article{10.11648/j.ijem.20261001.11,
      author = {Taiwo Kolawole Ogunyinka and Solomon Olalekan Akinola and Emmanuel Adebowale Adediran},
      title = {A Multi-layer Perceptron Framework for Pre-admission Disciplinary Risk Prediction in Nigerian Universities: 
    A Fairness-aware Approach Using Synthetic Data},
      journal = {International Journal of Engineering Management},
      volume = {10},
      number = {1},
      pages = {1-13},
      doi = {10.11648/j.ijem.20261001.11},
      url = {https://doi.org/10.11648/j.ijem.20261001.11},
      eprint = {https://article.sciencepublishinggroup.com/pdf/10.11648.j.ijem.20261001.11},
      abstract = {Nigerian universities have long struggled to identify, before matriculation, which applicants are likely to become disciplinary problems on campus. Existing screening procedures are largely manual and reactive — problems surface after enrolment rather than at the gate. To close this gap, we built and tested a Multi-Layer Perceptron classifier that assigns each applicant a probabilistic risk score at the point of admission, giving institutional officers an evidence-based basis for early counselling and targeted resource deployment, well before misconduct occurs. Working with real student records was not feasible. Nigeria's data protection obligations impose strict constraints on profiling, and authentic admission data from universities was unavailable for this research. We therefore generated 5,000 synthetic applicant profiles using a Conditional Tabular GAN, a method purpose-built for datasets that mix continuous, ordinal, and categorical variables. Three statistical tests — the Kolmogorov–Smirnov statistic, Wasserstein distance, and Jensen–Shannon divergence — confirmed that the synthetic profiles reproduced the structural properties of realistic admission populations with high fidelity. Under five-fold stratified cross-validation, the MLP returned an accuracy of 0.841 ± 0.018, F1-score of 0.812 ± 0.021, and AUC-ROC of 0.891 ± 0.014, outperforming Logistic Regression, Random Forest, SVM, and XGBoost across all reported metrics. Two findings deserve particular attention. First, SHAP attribution analysis singled out prior disciplinary record and JAMB score as the variables driving predictions most strongly — a result with direct implications for what admissions officers should scrutinize. Second, the model treated applicants from different geopolitical zones unequally; an EOD of 0.078 across zones exceeded acceptable thresholds. Fairness-regularized retraining brought that Figure down to 0.043 with less than one percentage point of accuracy lost. To prevent the system from operating as a black box, a three-tier human-in-the-loop review protocol is proposed, and the entire deployment framework is mapped against Nigeria's National Data Protection Regulation and Data Protection Impact Assessment requirements.},
     year = {2026}
    }
    

    Copy | Download

  • TY  - JOUR
    T1  - A Multi-layer Perceptron Framework for Pre-admission Disciplinary Risk Prediction in Nigerian Universities: 
    A Fairness-aware Approach Using Synthetic Data
    AU  - Taiwo Kolawole Ogunyinka
    AU  - Solomon Olalekan Akinola
    AU  - Emmanuel Adebowale Adediran
    Y1  - 2026/05/18
    PY  - 2026
    N1  - https://doi.org/10.11648/j.ijem.20261001.11
    DO  - 10.11648/j.ijem.20261001.11
    T2  - International Journal of Engineering Management
    JF  - International Journal of Engineering Management
    JO  - International Journal of Engineering Management
    SP  - 1
    EP  - 13
    PB  - Science Publishing Group
    SN  - 2640-1568
    UR  - https://doi.org/10.11648/j.ijem.20261001.11
    AB  - Nigerian universities have long struggled to identify, before matriculation, which applicants are likely to become disciplinary problems on campus. Existing screening procedures are largely manual and reactive — problems surface after enrolment rather than at the gate. To close this gap, we built and tested a Multi-Layer Perceptron classifier that assigns each applicant a probabilistic risk score at the point of admission, giving institutional officers an evidence-based basis for early counselling and targeted resource deployment, well before misconduct occurs. Working with real student records was not feasible. Nigeria's data protection obligations impose strict constraints on profiling, and authentic admission data from universities was unavailable for this research. We therefore generated 5,000 synthetic applicant profiles using a Conditional Tabular GAN, a method purpose-built for datasets that mix continuous, ordinal, and categorical variables. Three statistical tests — the Kolmogorov–Smirnov statistic, Wasserstein distance, and Jensen–Shannon divergence — confirmed that the synthetic profiles reproduced the structural properties of realistic admission populations with high fidelity. Under five-fold stratified cross-validation, the MLP returned an accuracy of 0.841 ± 0.018, F1-score of 0.812 ± 0.021, and AUC-ROC of 0.891 ± 0.014, outperforming Logistic Regression, Random Forest, SVM, and XGBoost across all reported metrics. Two findings deserve particular attention. First, SHAP attribution analysis singled out prior disciplinary record and JAMB score as the variables driving predictions most strongly — a result with direct implications for what admissions officers should scrutinize. Second, the model treated applicants from different geopolitical zones unequally; an EOD of 0.078 across zones exceeded acceptable thresholds. Fairness-regularized retraining brought that Figure down to 0.043 with less than one percentage point of accuracy lost. To prevent the system from operating as a black box, a three-tier human-in-the-loop review protocol is proposed, and the entire deployment framework is mapped against Nigeria's National Data Protection Regulation and Data Protection Impact Assessment requirements.
    VL  - 10
    IS  - 1
    ER  - 

    Copy | Download

Author Information
  • Abstract
  • Keywords
  • Document Sections

    1. 1. Introduction
    2. 2. Related Work
    3. 3. Methodology
    4. 4. Results
    5. 5. Discussion
    6. 6. Limitations and Future Work
    7. 7. Conclusion
    Show Full Outline
  • Abbreviations
  • Author Contributions
  • Conflicts of Interest
  • References
  • Cite This Article
  • Author Information